Safety data

Read the Minneapolis traffic safety data, studies and statistics.

Vision Zero by the numbers

Vision Zero uses data to target improvements that will

  • Reduce crashes
  • Save lives
  • Address inequities experienced on the street related to crashes

Between 2017 and 2021, about 150 people each year died or were severely injured in traffic crashes in our city. That is unacceptable and preventable. The number of people killed or severely injured lowered from the mid-2000s until 2014. It’s been on the rise in recent years and has been especially high since 2020. 2021 saw 168 severe injury or fatal crashes, the highest number since 2017. Despite an increase in fatal and severe injury crashes, all other crashes have decreased in recent years.

Crashes more likely on certain streets

Minneapolis crashes and injuries happen more often on a small percentage of streets.
These streets often have a high amount of activity through walking, biking, transit, and driving.

The High Injury Street Network 

This photo shows the concentration of high injury and fatal crashes on Minneapolis streets.

  • There are 9% of streets where 66% of the fatal and severe injury crashes happened between 2017-2021.
2022 High Injury St Network Vision Zero


Minneapolis Traffic Safety Facts

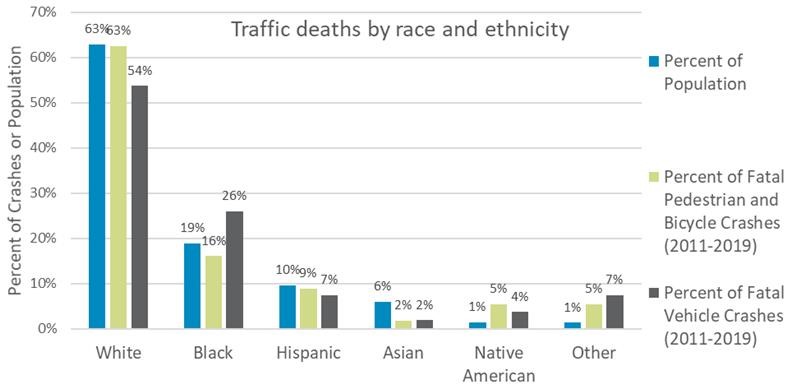
Native American residents are disproportionately impacted by traffic deaths

Traffic fatalities impact Native American and Black residents more than other groups.


Traffic Deaths by Race Vision Zero

Native American and Black residents experienced traffic crashes in a disproportionate way. This is consistent with trends in earlier years. This means compared to population size, they are more affected by this issue.

Native American resident impacts

Native American residents are 1% of the Minneapolis population. Yet, they are 5% of people killed in pedestrian and bicycle traffic crashes. They are 4% of people killed in vehicle crashes.

Black resident impacts

Black residents are 19% of Minneapolis population but are 26% of people killed in vehicle crashes.

More resident impacts (Not disproportionately affected)

Hispanic residents are 10% of the population and are 9% of people killed in pedestrian and bicycle crashes, and 7% of people killed in vehicle crashes.

White and Asian residents are less likely to die in traffic crashes.


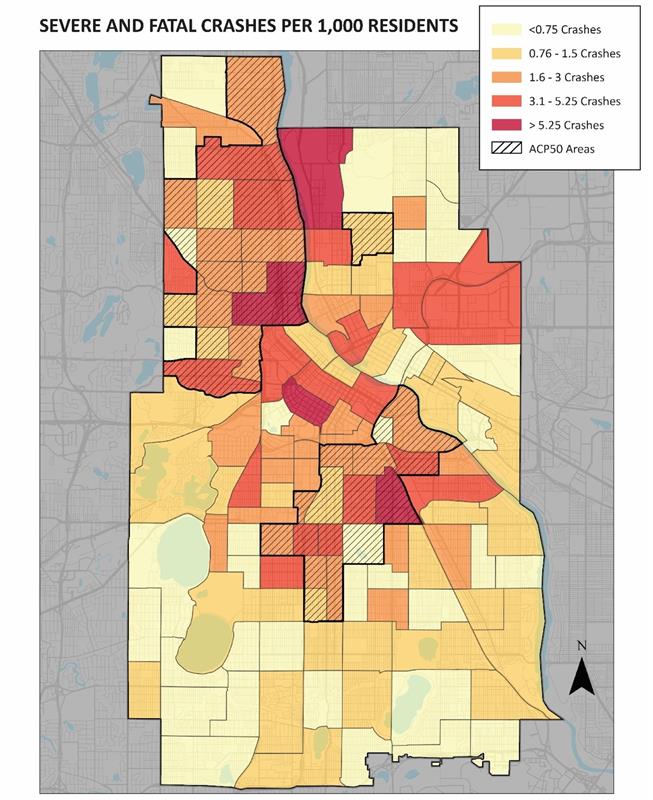
Crashes are more concentrated in lower income neighborhoods

ACP50 areas are areas of concentrated poverty where over half of residents are people of color.

  • 26% of Minneapolis residents live in ACP50 areas, and 22% of streets are in ACP50 areas.
  • 40% of severe and fatal crashes occurred in these areas from 2017-2021
Severe and Fatal Crashes Vision Zero

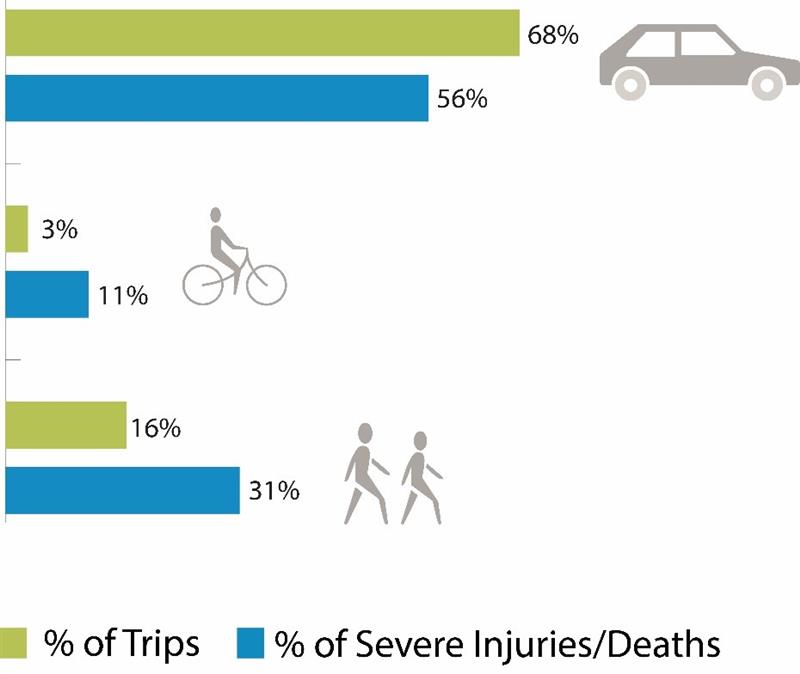
Bicyclists and pedestrians overrepresented in severe traffic injuries and deaths

 Bar chart depicting that bicyclists and pedestrians are overrepresented in severe traffic injuries and deaths. Source: Injuries/deaths from Vision Zero Crash Study, percent of trips from 2010 Met Council Travel behavior inventory. Auto category includes cars, trucks and motorcycles, but not transit.

Pedestrians

People in Minneapolis make 15 percent of their trips by walking or rolling. These pedestrians are 29 percent of severe traffic injuries and deaths.

Bicyclists

People in Minneapolis make 4 percent of their trips by bicycle. Bicyclists are 16 percent of severe traffic injuries and deaths.

Other groups (not overrepresented)

People in Minneapolis make 67 percent of their trips by automobile. Automobile crashes make up 55 percent of severe traffic injuries and deaths.

Speed is a major factor in crashes

Higher traffic speeds make crashes more likely to happen. It also makes crashes more likely to end in severe injury or death. This is especially true for people walking or rolling and biking.

speeding leads to crashes


  • A person hit at 20 miles per hour has a 13% likelihood of suffering a severe injury or dying.
  • A person hit at 30 miles per hour has a 40% likelihood of suffering a severe injury or dying.
  • A person hit at 40 miles per hour has a 73% likelihood of suffering a severe injury or dying.

The risk of severe injury or death is higher for older adults.

The involvement of speeding in crashes has increased significantly, especially among fatal crashes.

  • In Minneapolis, speeding was a contributing factor in 50% of fatal crashes in 2020 and 65% of fatal crashes in 2021.
  • This is a greater involvement than previous years as well as national trends. Speeding was a contributing factor of 43% of fatal crashes in 2017. Nationally, it was a contributing factor in 29% of traffic fatalities in 2020.

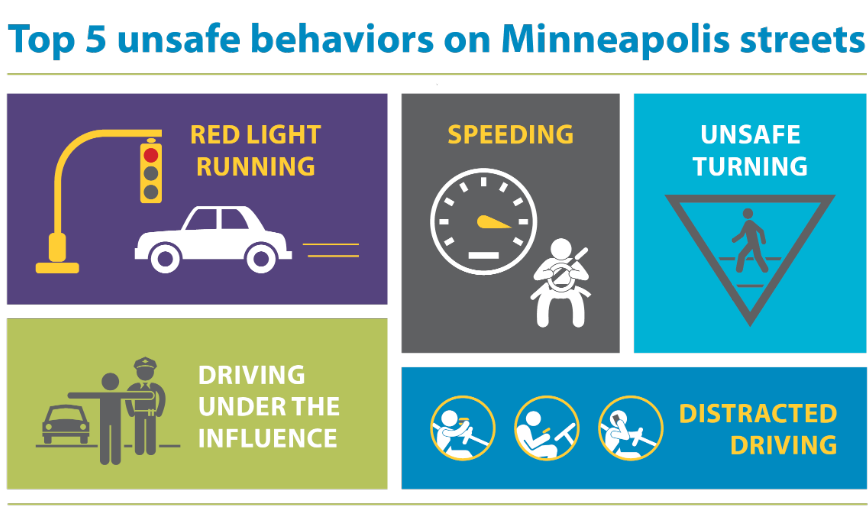
The Five Unsafe Driving Behaviors

Five unsafe behaviors lead to most crashes

The five behaviors that lead to the most severe and fatal crashes on Minneapolis streets: 

  • Red light running
  • Speeding
  • Driving under the influence of alcohol or drugs
  • Unsafe turning (failing to yield the right-of-way when turning)
  • Distracted driving
Map with various icons showing the top 5 unsafe behaviors on Mpls streets. Red light running, Speeding, Driving under the influence of alcohol or drugs, Unsafe turning (failing to yield the right-of-way when turning), distracted driving.

Source: Analysis of crash dataset used in the 2019 Vision Zero Crash Study.

Read more safety data

Read the full Pedestrian Crash Study and Vision Zero Crash Study. These studies analyze vehicle and bicycle crashes and show our findings.

Request accessible format

If you need help with this information, please email 311, or call 311 or 612-673-3000.

Please tell us what format you need. It will help us if you say what assistive technology you use.

Contact us